Investing in the stock market can feel confusing, especially when you hear terms like FII and DII data. But understanding this data can make your investment journey much easier. In this blog post, we will explain what FII and DII data mean, why they are important, and how Chartink can help you use this information to make smarter decisions.
What is FII and DII Data?
FII stands for Foreign Institutional Investors, and DII stands for Domestic Institutional Investors. These terms refer to large organizations or funds that invest heavily in the stock market. FIIs are based outside of the country, while DIIs are from within the country.
The FII and DII data show how much these institutions are buying or selling in the market. This data is important because it reflects the mood of the market. For example, if FIIs are buying stocks, it can signal positive sentiment. On the other hand, if they are selling, it might be a warning of a downturn.
Why is FII and DII Data Important?
Tracking FII and DII data can help you make informed decisions. Here are some reasons why:
- Market Trends: FII and DII activity often impacts market trends. When FIIs invest heavily, it usually boosts the market. When they withdraw, it can lead to a decline.
- Investor Sentiment: The data provides clues about how confident investors are in the market. FIIs tend to invest in growing markets, while DIIs usually stabilize the market during volatility.
- Stock Picking: Knowing which stocks are being targeted by FIIs and DIIs can help you choose the right investments. For example, if both groups are buying a specific stock, it might indicate strong potential.
How Chartink Helps You Analyze FII and DII Data
Chartink is a powerful tool that makes it easy to track and analyze FII and DII data. Here’s how it helps:
- Live Data Updates: Chartink provides live updates on FII and DII buying and selling activity. This keeps you informed about market movements in real time.
- Customizable Scanners: You can use Chartink’s scanners to filter stocks based on FII and DII trends. For instance, you can create a scanner to identify stocks with high FII buying.
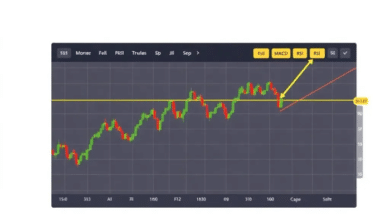
- Easy-to-Understand Charts: The platform offers user-friendly charts that show FII and DII activity over time. These charts make it simple to spot trends and patterns.
- Sector Analysis: Chartink also allows you to see which sectors are gaining attention from FIIs and DIIs. This can guide you toward promising investment areas.
How to Use FII and DII Data for Smarter Investing
Let’s look at some practical ways to use FII and DII data in your investment strategy:
1. Follow Market Trends
Pay attention to the overall buying and selling patterns of FIIs and DIIs. If FIIs are consistently buying, it’s often a good time to invest. Chartink makes it easy to track this data.
2. Combine with Other Indicators
FII and DII data is helpful, but it’s even more powerful when combined with other indicators. For example, use technical indicators like moving averages to confirm trends.
3. Focus on Popular Sectors
If FIIs and DIIs are investing heavily in a particular sector, it could mean that sector has growth potential. Use Chartink to identify these sectors and explore related stocks.
4. Avoid Panic Selling
When you see FIIs selling heavily, it can be tempting to sell your stocks too. But remember, DIIs often step in to stabilize the market. Analyze the data carefully before making decisions.
Benefits of Using Chartink for FII and DII Data
Chartink’s user-friendly features make it a go-to tool for investors. Here are some benefits:
- Save Time: Instead of manually checking FII and DII activity, Chartink shows all the data in one place.
- Better Decisions: The clear charts and customizable scanners help you make well-informed choices.
- Accessible for Everyone: Whether you’re a beginner or an experienced investor, Chartink’s tools are easy to use.
Frequently Asked Questions (FAQs) About FII and DII Data
What does FII and DII mean in the stock market?
FII refers to Foreign Institutional Investors, and DII refers to Domestic Institutional Investors. They are large investors who buy and sell stocks in significant amounts.
Why is FII and DII data important?
FII and DII data helps investors understand market trends and investor sentiment. It’s a key factor in making smarter investment decisions.
How can I track FII and DII data?
You can use tools like Chartink to track FII and DII data. It provides live updates, charts, and scanners to analyze the data easily.